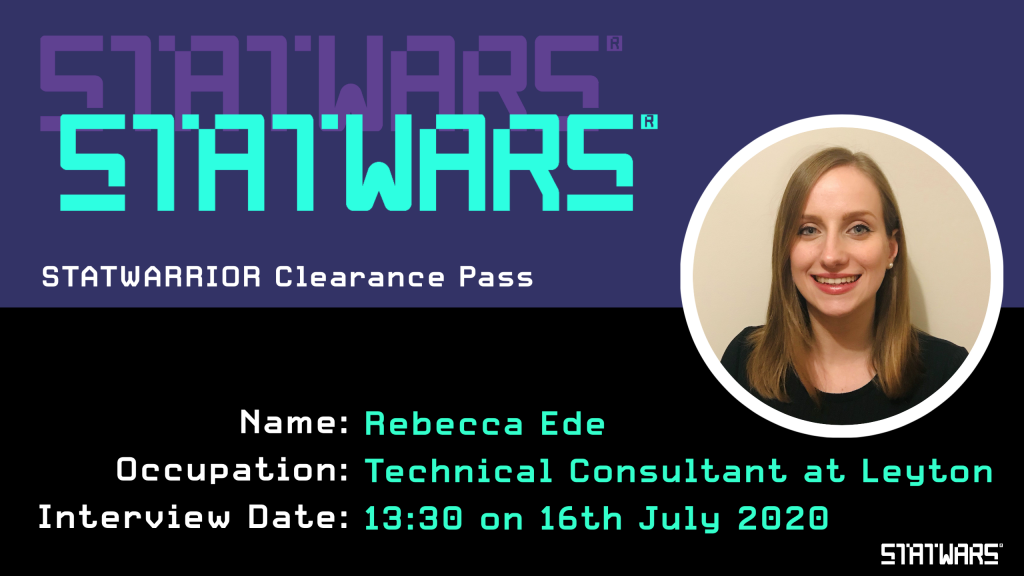
Leyton’s Mechanical Engineer, Rebecca Ede, gives amazing hints and tips to the STATWARS audience on how to successfully present data, the difference between qualitative and quantitative data, how data is used in different graph types and the usefulness of infographics!
During the Q&A, Rebecca answers: ‘What made you want to get into the data industry? Is it something you have always enjoyed?’, ‘Is Excel important when working with data?’, ‘Is Climate Change something that has always been important to you?’ and ‘Are there any shocking statistics that you have found during your work?’


